Three engines and one expansion set, each drawn with the figures from its own historical test. These are the same numbers as the research page, in a form you can keep. Every card says on its face what it is: a historical simulation, not a live return, and not a description of what the account holds right now. The live account, updated nightly whether it is up or down, is on the record page.
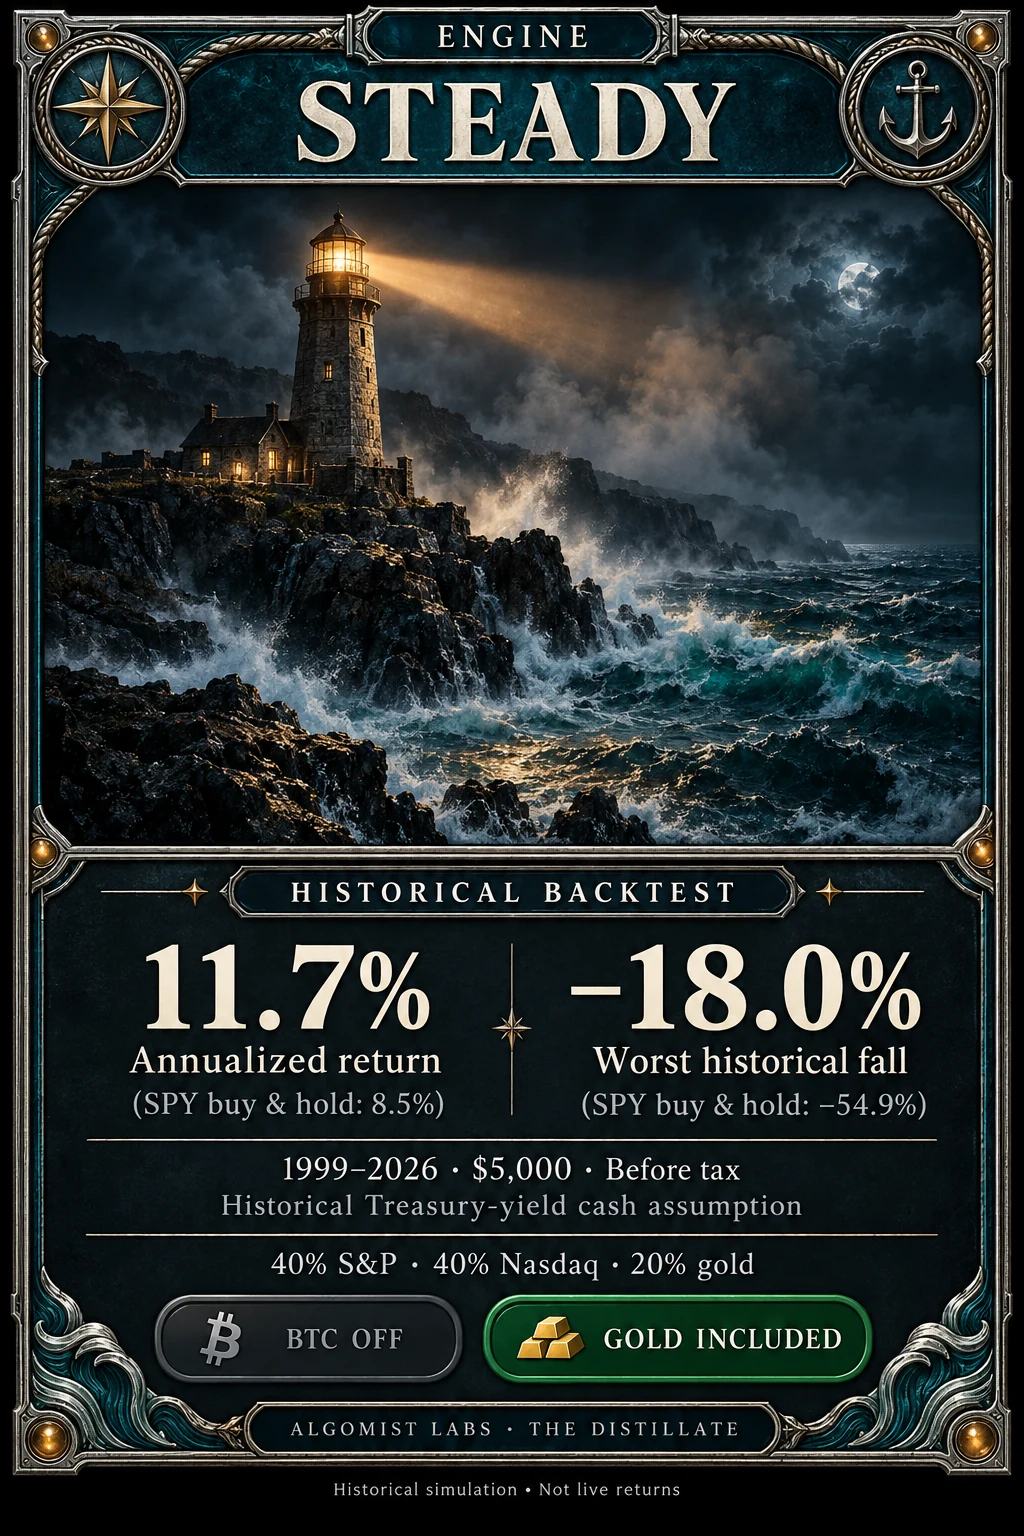
S&P 500, NASDAQ and gold in one book — 40 / 40 / 20 — each with the same monthly trend exit. Gold is included in STEADY; the bitcoin sleeve is off.
1999–2026 · $5,000 · before tax · historical Treasury-yield cash assumption
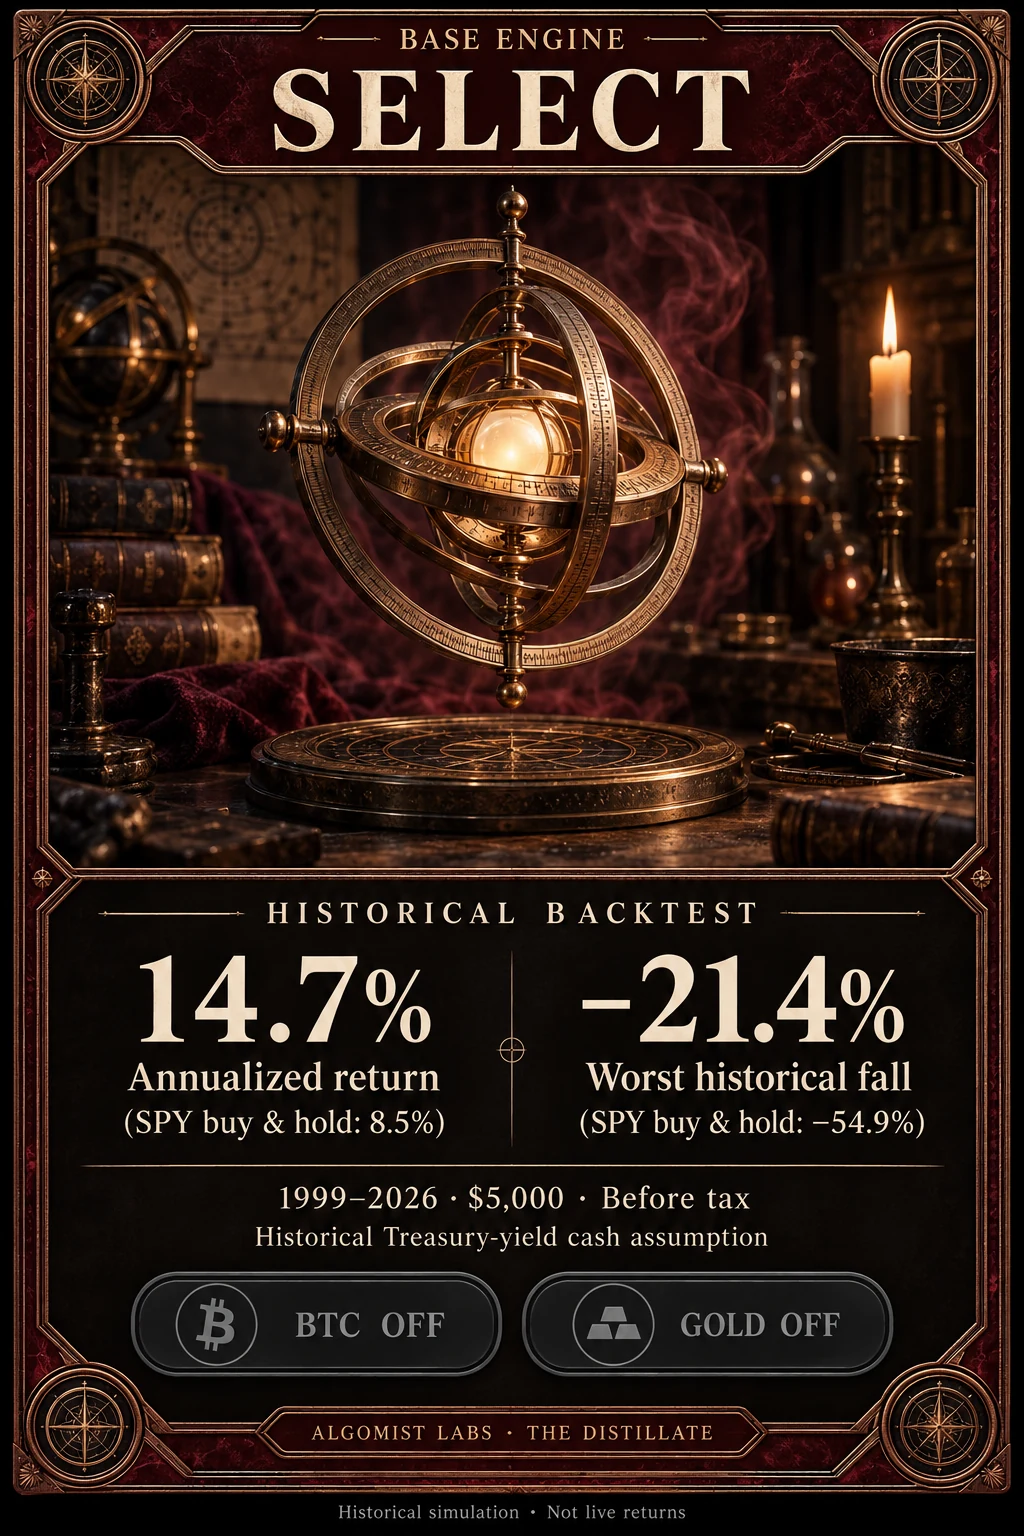
NASDAQ only, on the monthly trend exit. No bitcoin, no gold.
1999–2026 · $5,000 · before tax · historical Treasury-yield cash assumption
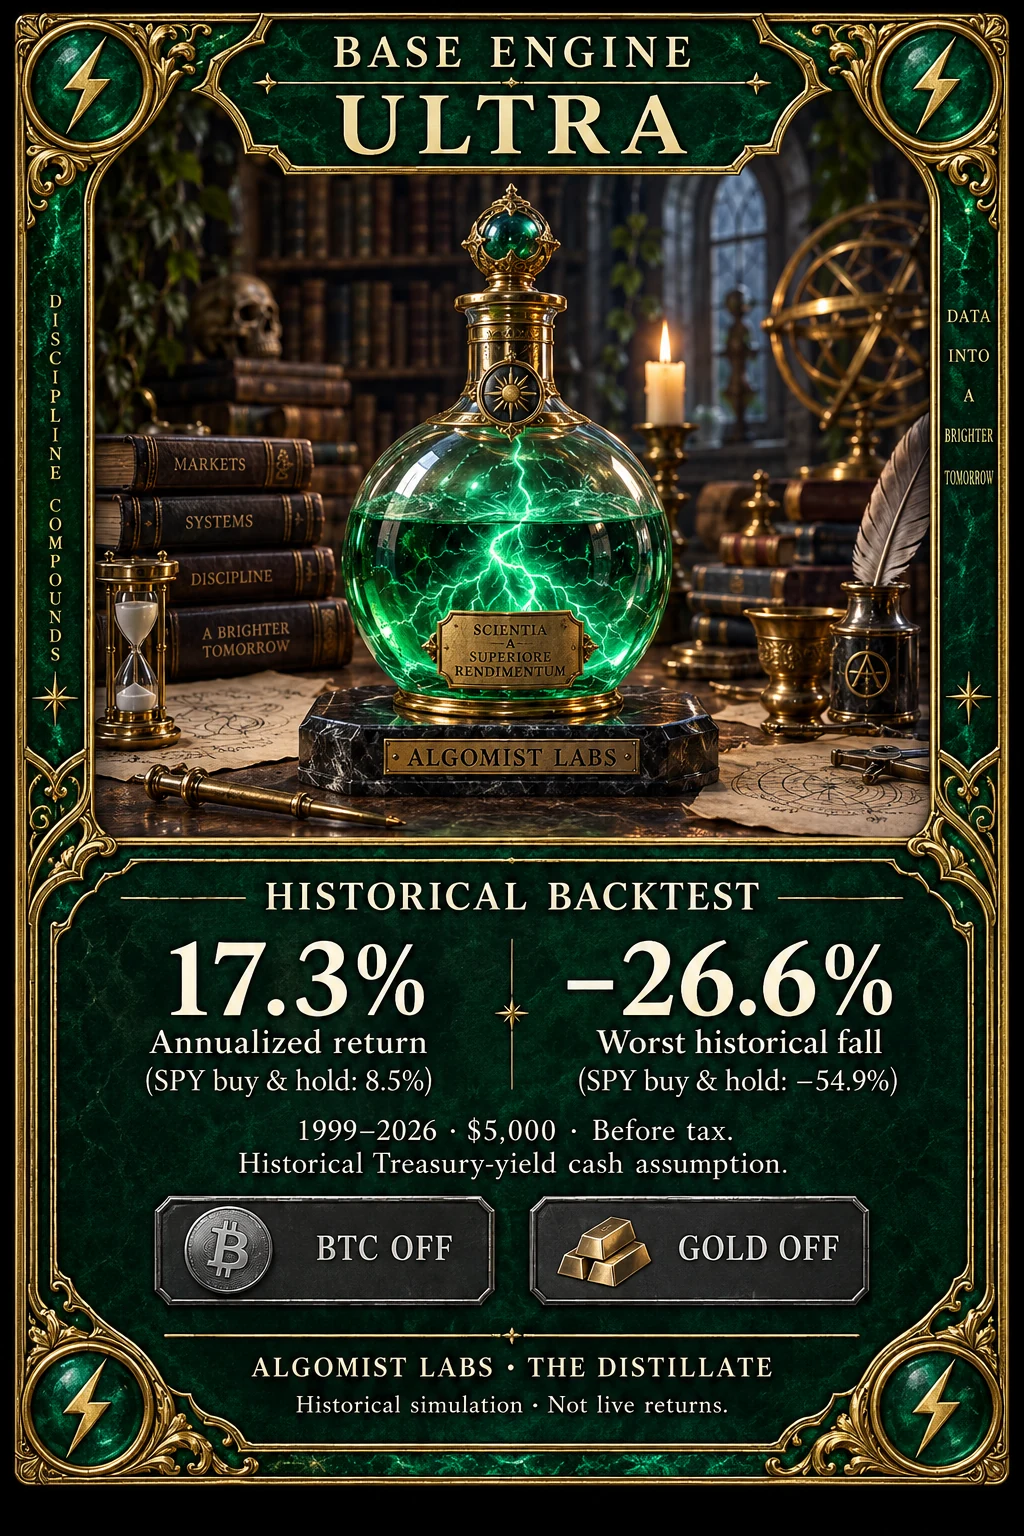
NASDAQ only, the same exit, run at a hotter calibration. No bitcoin, no gold.
1999–2026 · $5,000 · before tax · historical Treasury-yield cash assumption
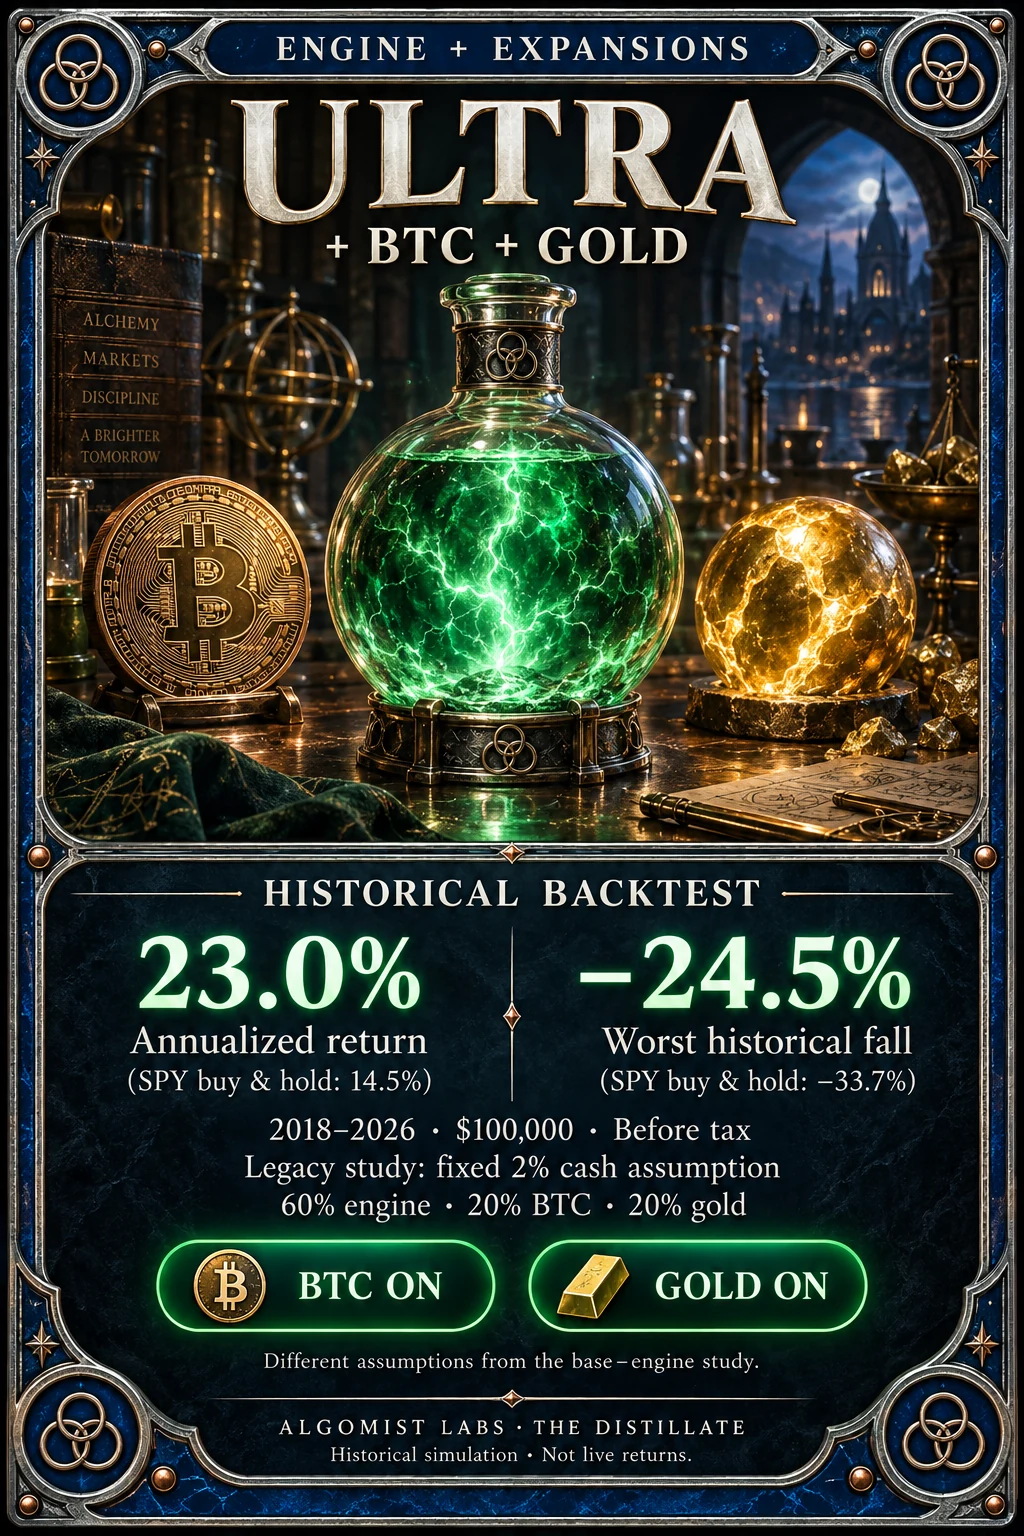
ULTRA with both expansion sleeves switched on — 60% engine, 20% bitcoin, 20% gold, each sleeve on its own monthly trend rule.
2018–2026 · $100,000 · before tax · legacy study, fixed 2% cash assumption
base ULTRA on this same window: 21.8%/yr · −27%
Provisional, 19 September 2026. The study behind the expansion card prices its bitcoin and gold sleeves with distributions included and its engine leg without them, so the two sides of its comparison are not measured the same way and its advantage is overstated by an amount we have not yet measured. The card itself cannot carry this note — the figures are painted into the image — so it is here instead, and the card will be reissued rather than relabelled.
One card is not measured the same way. The three base cards use the corrected cash assumption described on the research page, over the full cycle from 1999 at $5,000. The expansion card comes from the earlier bitcoin-and-gold study: a different window (2018 onward), a different account size ($100,000) and a fixed 2% cash assumption that the base figures no longer use. It is not a controlled comparison against the other three, and the card says so. So do not read 17.3% against 23.0% as the expansions winning by five and a half points. Measured over the expansion card’s own window, 2018 to 2026, the base ULTRA engine returned 21.8% a year with a −27% worst fall against the pack’s 23.0% and −24.5%. That is the edge the expansions actually bought: about a point and a quarter a year, and two points of fall. The rest of the distance between the two cards is the difference between twenty-seven years that include the dot-com crash and 2008, and eight years that include neither. Its buy-and-hold benchmark differs for the same reason: 14.5% a year with a −33.7% worst fall over 2018–2026, against 8.5% and −54.9% over the full cycle.
Tap any card for the full-size image. Frame colour marks the configuration, and a green badge means the sleeve is switched on. Nothing on a card reports live holdings or whether the engine is armed.
The research page → · The live account → · The expansions → · The Distillate →